|
InSight makes decision-making far more effective
- and fun!
A new "visual spreadsheet"
helps users easily create and apply system models
Decision-making can be hard enough even
when the choices seem simple: watch Leno or Letterman, cheer
for the Yankees or the Mets, order Cherry Garcia or Chunky
Monkey. But when the factors that affect the decision - and
the impact of the decision itself - loom large, decision-making
becomes a complex and critical task.
At that point, modeling the system in question
can dramatically improve your ability to make effective decisions.
If, for example, you're trying to eliminate bottlenecks in
a manufacturing plant, creating a mathematical model of the
production line helps pinpoint exactly where improvements
would most help boost productivity and profits.
Unfortunately, for many reasons convincing
decision-makers to take advantage of system models has proven
challenging. First, no streamlined method exists for pooling
the knowledge of decision-makers and appropriate experts to
produce a comprehensive picture of the system. Programming
the system model can be grueling and modifying it worse still.
And when the user finally puts the program to work, the output
may look as though it was spewed from a "black box"
- giving no idea how the program performed the calculations
or what the results really mean.
What's needed, then, is a rapid way to model
systems, analyze changes, and present the results. At the
same time, the modeling environment should be visual, intuitive,
quick, easy, and customizable. That's a tall order, and no
current off-the-shelf software meets these criteria. But GM
researcher Jeff Alden
decided to fill the void by developing an integrated systems
modeling environment called InSight. Alden had one more requirement
for his program as well - it had to be fun to use.
"In a lot of ways, InSight is like
a visual spreadsheet," says Alden, Senior Staff Research
Engineer in the Manufacturing Systems Research Laboratory.
"Many people use spreadsheets like Excel to help them
analyze problems. InSight goes further, by showing users how
the various pieces of the puzzle fit together, what data they
need to solve a problem, how the program will calculate the
results, and how the results change by varying the inputs."
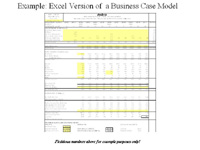 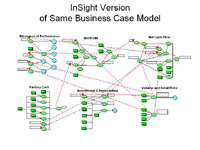
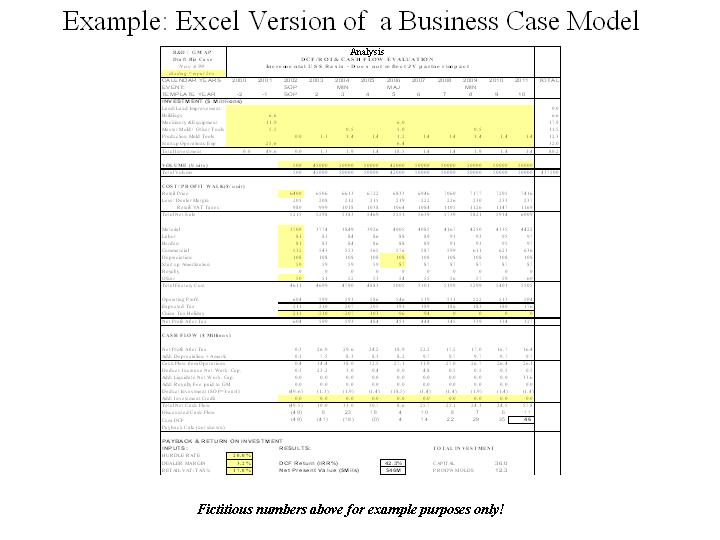
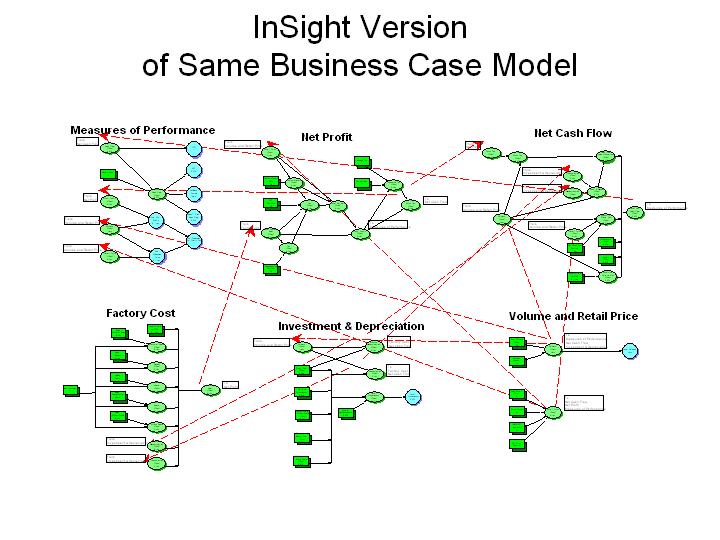
Click on the small images above for a
closer look at how Excel and InSight differ in their handling
of business case models.
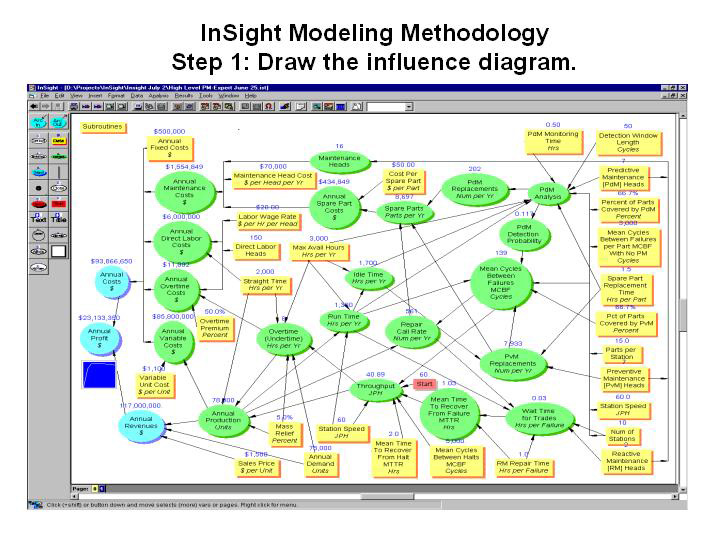
With InSight, users begin developing a model
by drawing an influence diagram, which shows how all the elements
that comprise the system relate to each other. This calls
for collaboration among hands-on personnel, subject-matter
experts, and decision-makers to determine the model's inputs
and outputs. The influence diagram for the Maintenance Operations
Planning Tool, for instance, shows every element that could
affect Cost and Revenue - and ultimately Profit - as a node
or bubble in the model.
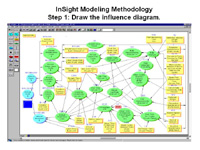 
Click on the image above for a closer
look at the influence diagram and equations entered for the
Maintenance Operations Planning Model.
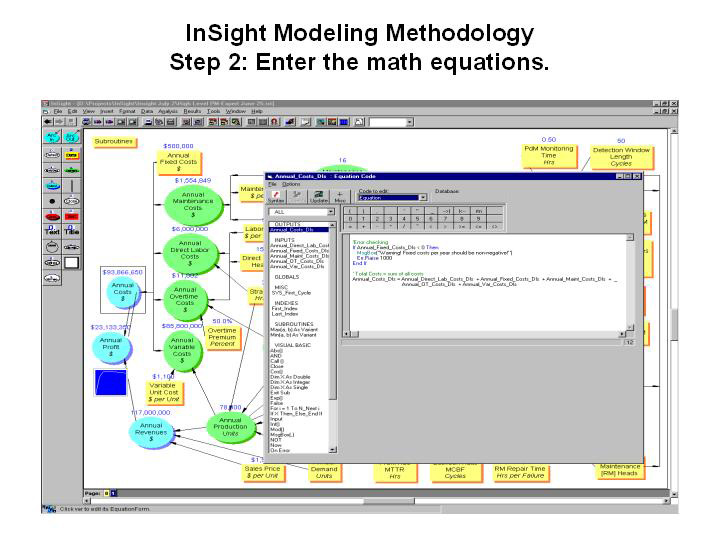
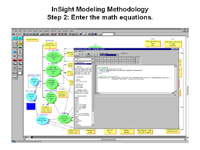
In the next step, experts enter all the
math equations that correspond to those nodes. If the ultimate
output of a model is profit, then the equation Profit = Revenue
- Cost will appear as one of the calculations. Although that's
certainly straightforward enough, nodes can use far more extensive
computations, including optimization routines with thousands
of lines of code.
During the third step, users choose the
type of analysis they want. InSight contains a number of capabilities,
including cases, cost drivers, optimization, simulation, and
ranges.
Using InSight to solve problems
For the Maintenance
Model, the plant's management wanted to determine how plant
profit changes depending on maintenance staffing levels. The
plant in question used three different types of maintenance
personnel - reactive to fix problems that arise; predictive
to measure key parameters and anticipate when problems might
occur; and preventive to proactively perform tasks
before problems occur, such as replacing a belt before it
wears out and shuts down production.
"The model helped determine how many
people should be assigned to each level," says Alden.
"We started with most people in reactive maintenance,
then slowly moved them to predictive maintenance to see what
happens. As we changed the number of personnel, the nodes
that show the results began to grow or shrink. You can actually
see the changes, as though you were running a movie."
And what did the results show? "At
first, increasing the number of predictive personnel helped
the plant meet demand, generate more products, and increase
profit," Alden noted. "But eventually, the few reactive
maintenance personnel left couldn't keep up with repairs.
Then throughput dropped and profit took a big dive. But by
looking at the influence diagram, you can see a sweet spot
where the plant is using the optimal number of maintenance
personnel in each category."
Not only is InSight effective for decision-making,
but it's also a dynamic way to show how a system is evolving.
Users have put InSight to work in a variety of different applications,
from sourcing decisions to risk management to vehicle planning
and evaluation. In recognition of the program's positive impact
on GM's business and of the extraordinary effort Alden and
his colleague Dan Reaume put into developing InSight, GM R&D
awarded them the McCuen Award.
InSight obviously has application far beyond
GM's business, and the rest of the world may soon get a chance
to use it: GM is working with a software consulting firm to
commercialize InSight, and Alden and Reaume are writing a
book on decision analysis using influence diagrams.
"Within GM, InSight has proven
to be a powerful tool that people can use to collaborate on
building models, while having fun and making better decisions
in the process," he says. "That's the reason I developed
the program and where I still hope to see its major impact."
By Diane Kightlinger
|